Note: Windows & Waves Tracker is currently preparing for its first feedback testing group. Because this is a health-related tracking app, we’re completing the required business and app store verification steps before inviting testers. Thank you for your patience as we build this carefully and responsibly.
Windows & Waves
Withdrawal is often nonlinear. Windows & Waves helps you track patterns, medication adjustments, and daily symptoms in one structured system. See trends over time through clear visual analytics designed to support safer tapering decisions.
Built for both predictable and complex withdrawal journeys — designed specifically for antidepressant discontinuation patterns.
What are Windows & Waves?
Windows & Waves is a community term used to describe the fluctuations of the severity of symptoms experienced by people withdrawing from antidepressants and benzodiazepines.
Waves are a period of intense symptoms, while windows are periods of less intense symptoms or even a temporary remission of symptoms.
Oftentimes, symptoms tend to follow this up-and-down pattern rather than a steady, downward progression.
Overall Severity of Symptoms During Withdrawal
Example of a gradual downward trend with windows and waves over time. Do not use as a comparison to your data.
Why Track Your Windows & Waves?
Tracking helps you understand your unique patterns. Over time, you can spot trends in symptoms, mood, triggers, and recovery. What once felt random starts to make sense when you can see your experience laid out in front of you.
Data highlights improvements you may miss day-to-day. You can see how sleep, stress, medications, and routines affect you — and what truly helps. Patterns make it easier to plan ahead, prepare for tough days, and celebrate the good ones. Tracking helps you pace yourself and protect your energy.
Seeing that windows do return — and waves do pass — can be deeply reassuring. When you understand your waves, they feel less unpredictable, less confusing, and less overwhelming.
See the Flow, One Small Step at a Time
Windows & Waves is designed to fit into your day without overwhelming you. Spend a minute after each window or wave to record what matters — the app handles the patterns.
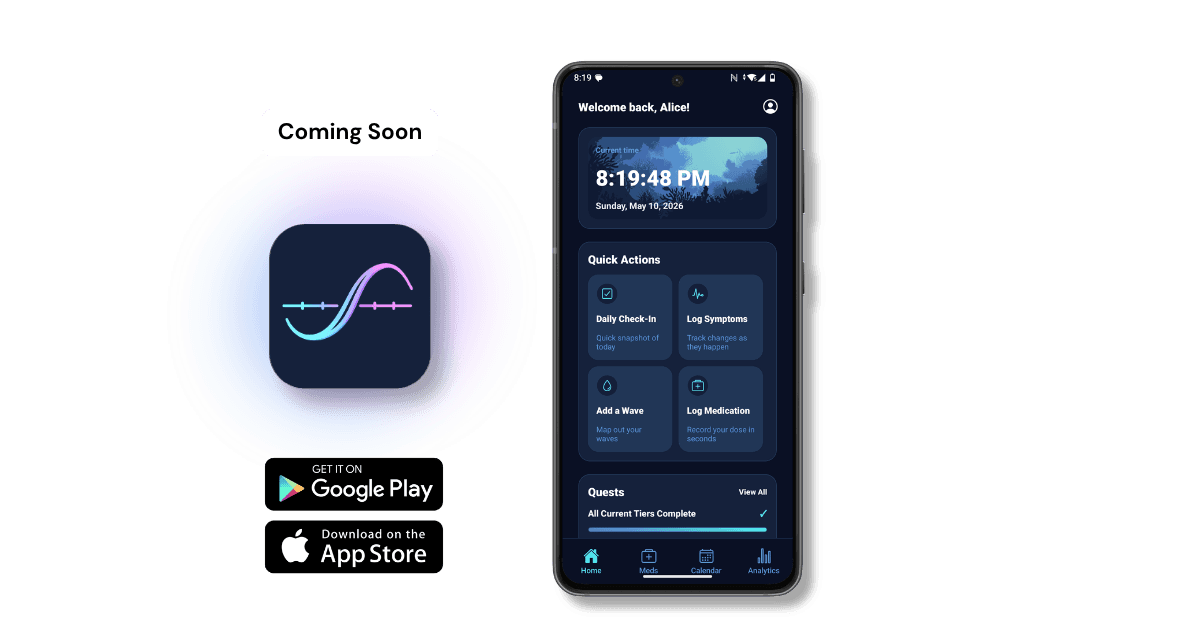
Step 1 · Download the App
Step 1 · Download the App
Install the app on your phone to start logging your daily data. As soon as you begin logging, you’ll see your charts update automatically in Analytics.
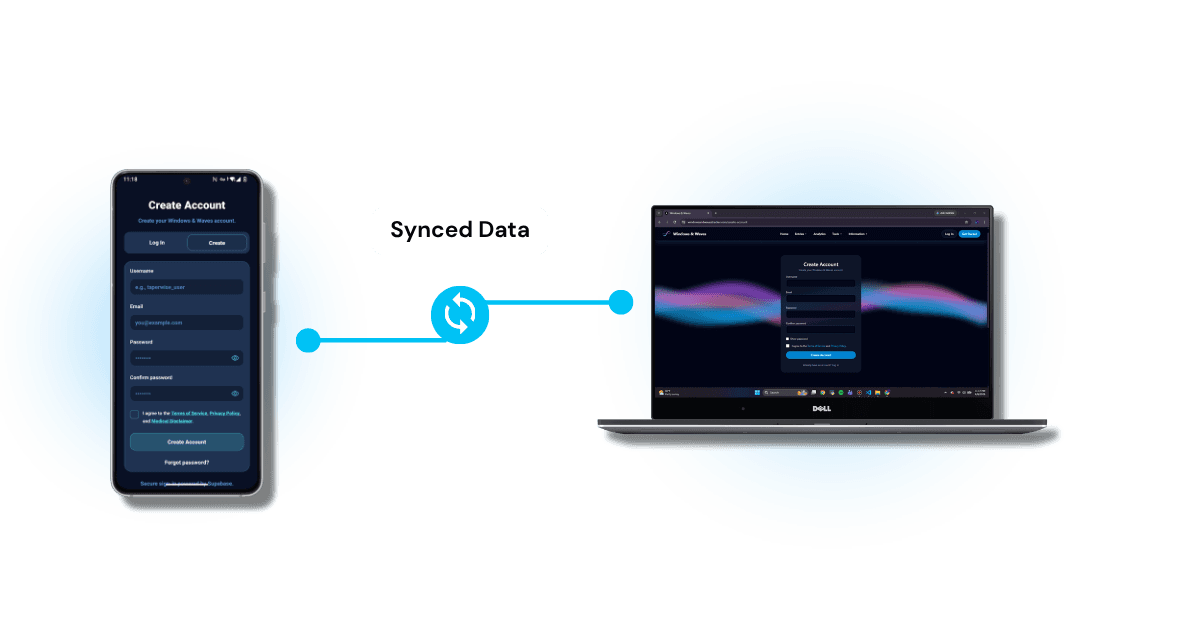
Step 2 · Create Your Account
Step 2 · Create Your Account
Sign up on either the app or the website — your account keeps everything synced. Your data stays connected so you can view it from both places at any time.
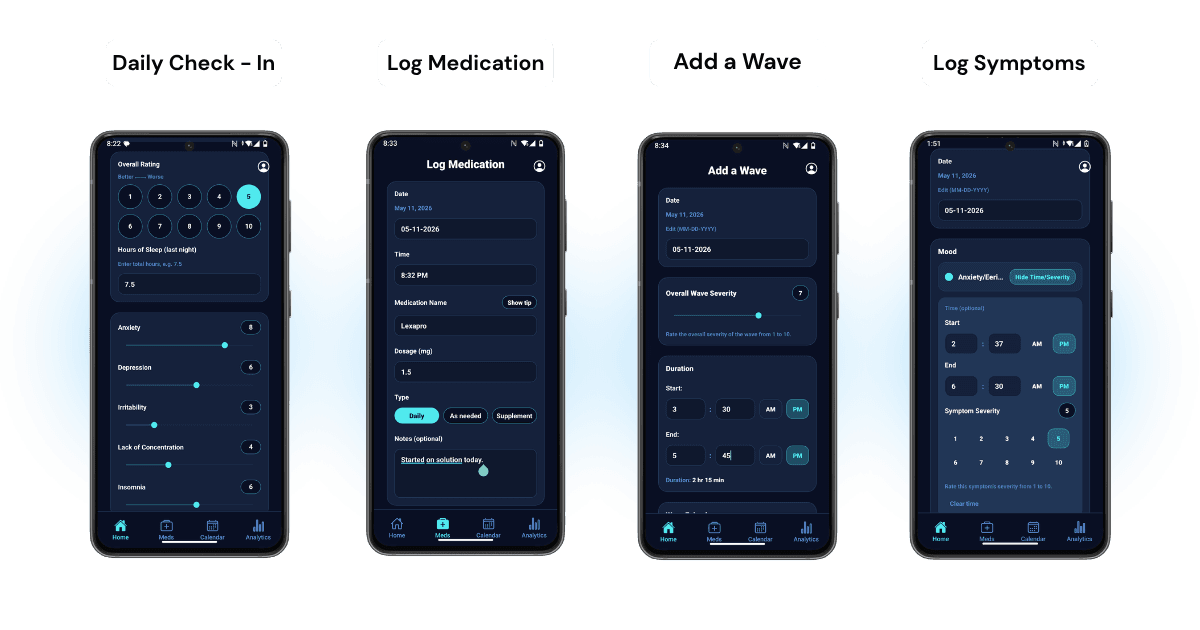
Step 3 · Log Your Windows & Waves
Step 3 · Log Your Windows & Waves
- Use simple scales to track overall severity.
- Record medication times and dosages.
- Mark when a window or wave begins and ends.
- Tag symptoms so patterns stay clear over time.
Step 4 · See Patterns & Understand Your Data
Step 4 · See Patterns & Understand Your Data
- Visualize your patterns through charts and graphs.
- Spot changes with simple trends and summaries.
- Use the web dashboard for deeper comparisons and more context.
- Log as much detail as you want — more data creates a clearer picture.
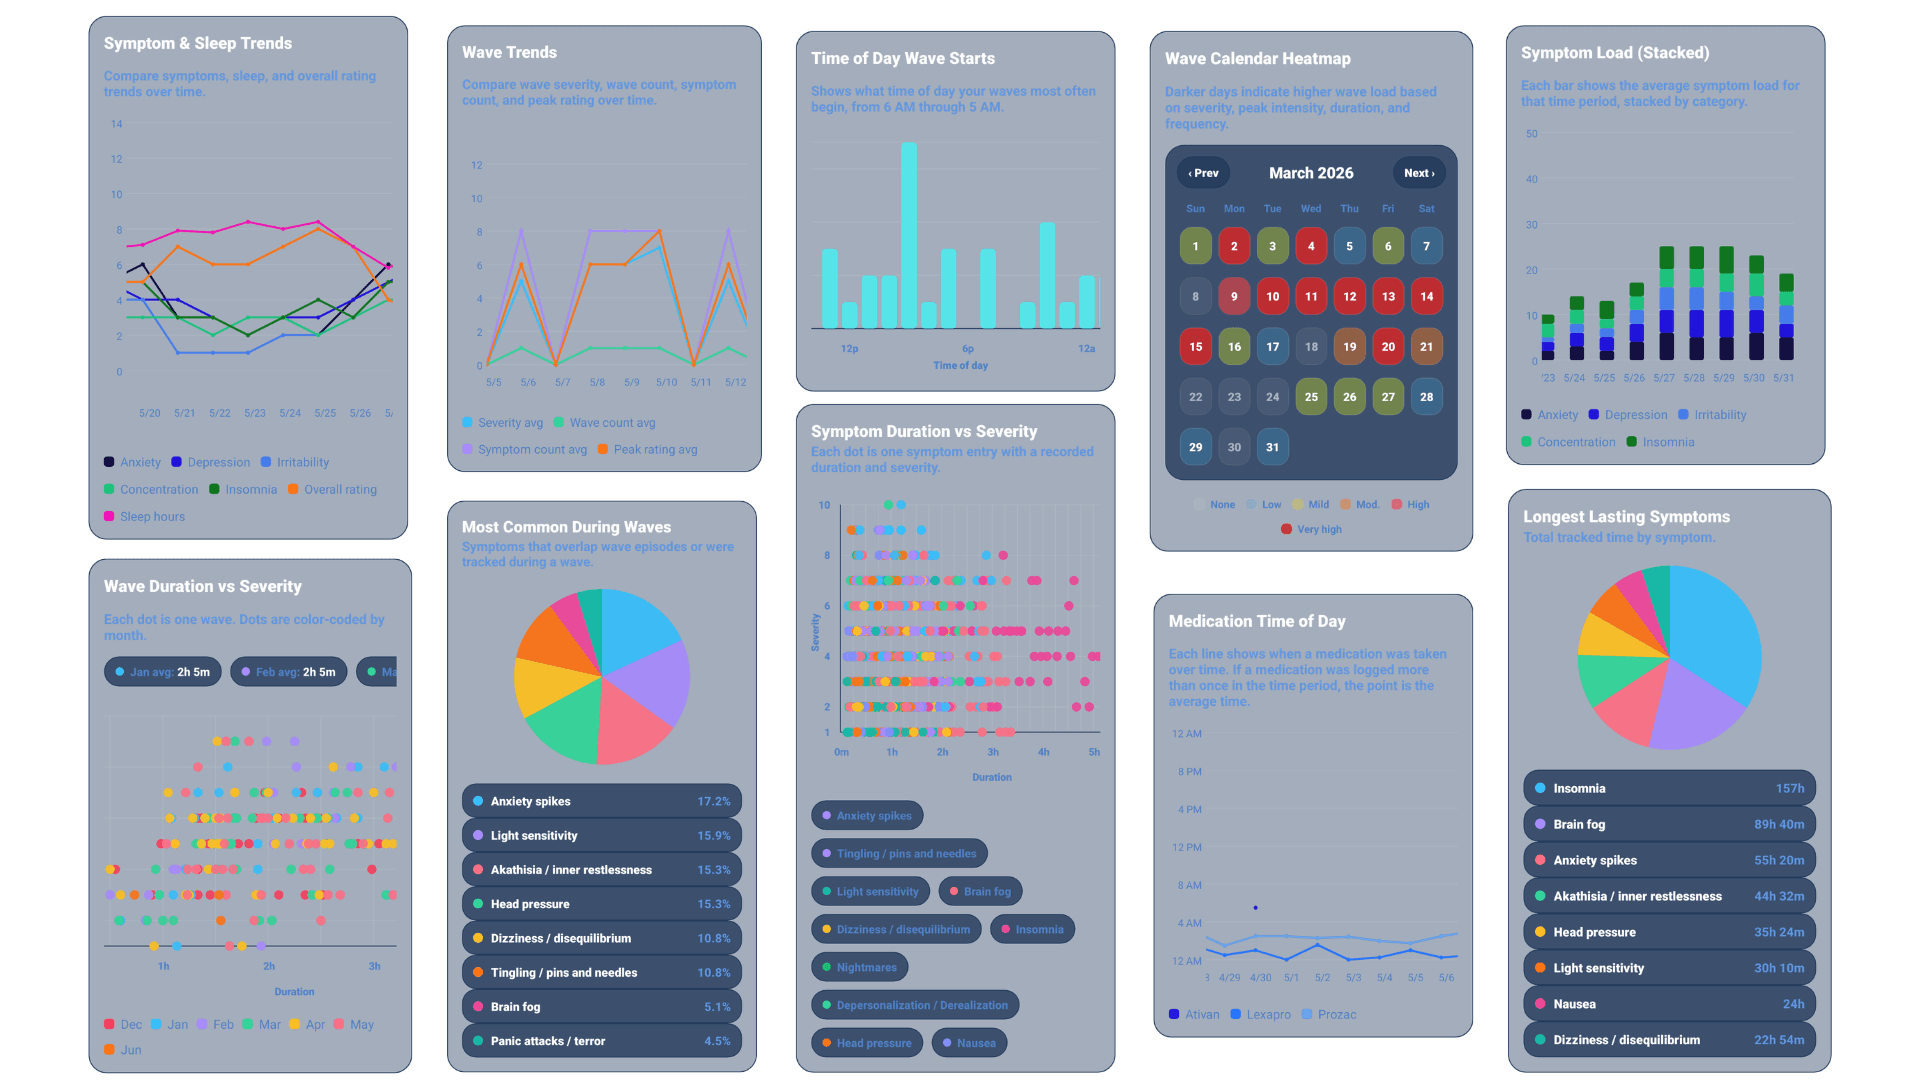
All graphs shown are available with Pro membership.
Advanced Analytics
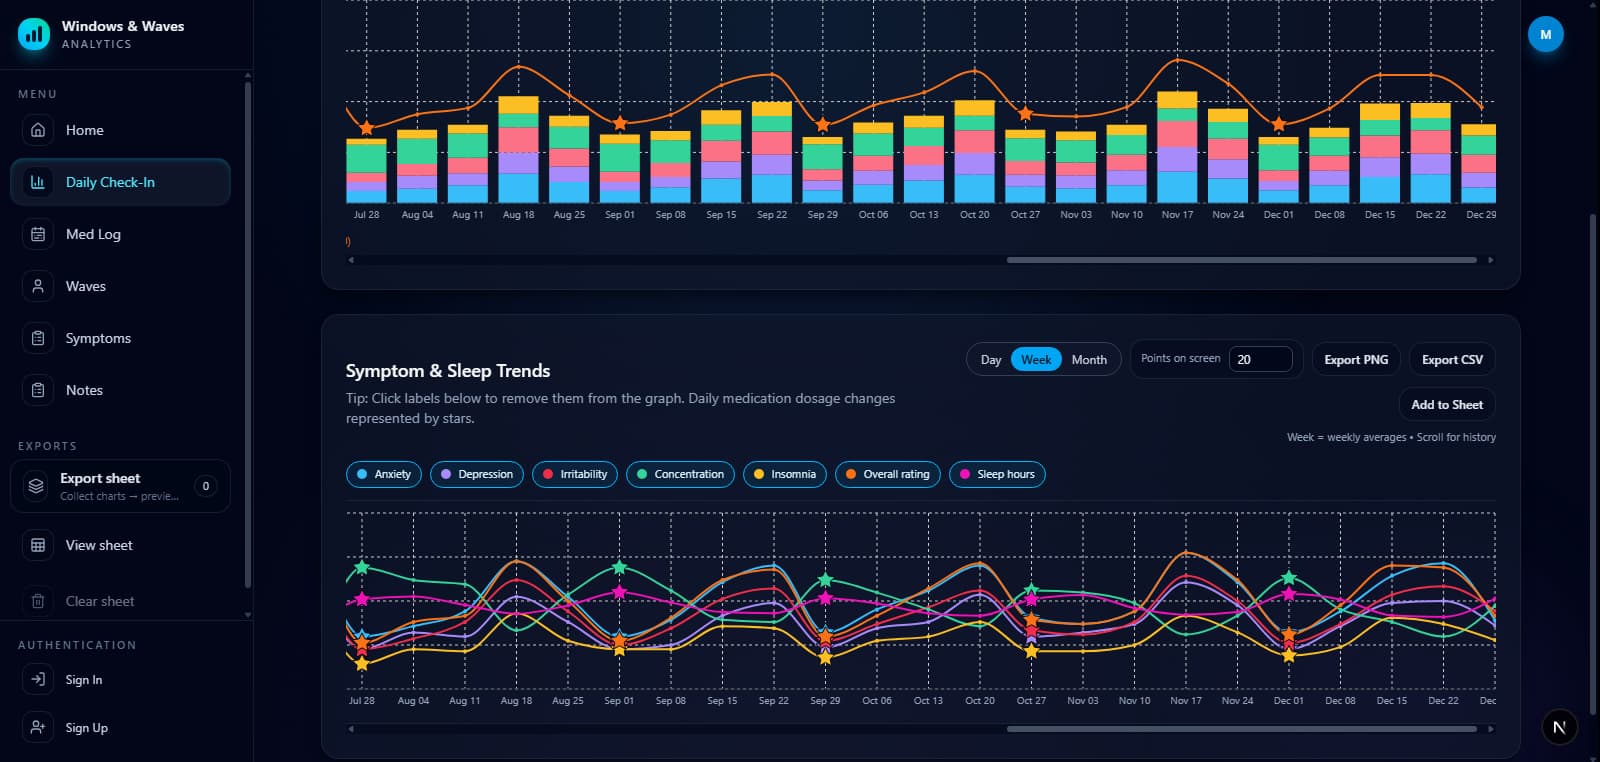
Upgrade to Pro to unlock deeper insights on both the mobile app and desktop dashboard, including advanced graphs, expanded analytics, and clean printable exports. Below is a preview of the daily check-in stacked bar graph.
Daily Check-In — Combined View (Preview)
Demo chart with fake wave-pattern data. Stacked symptoms, an overall trend line, and stars for dose-change days.
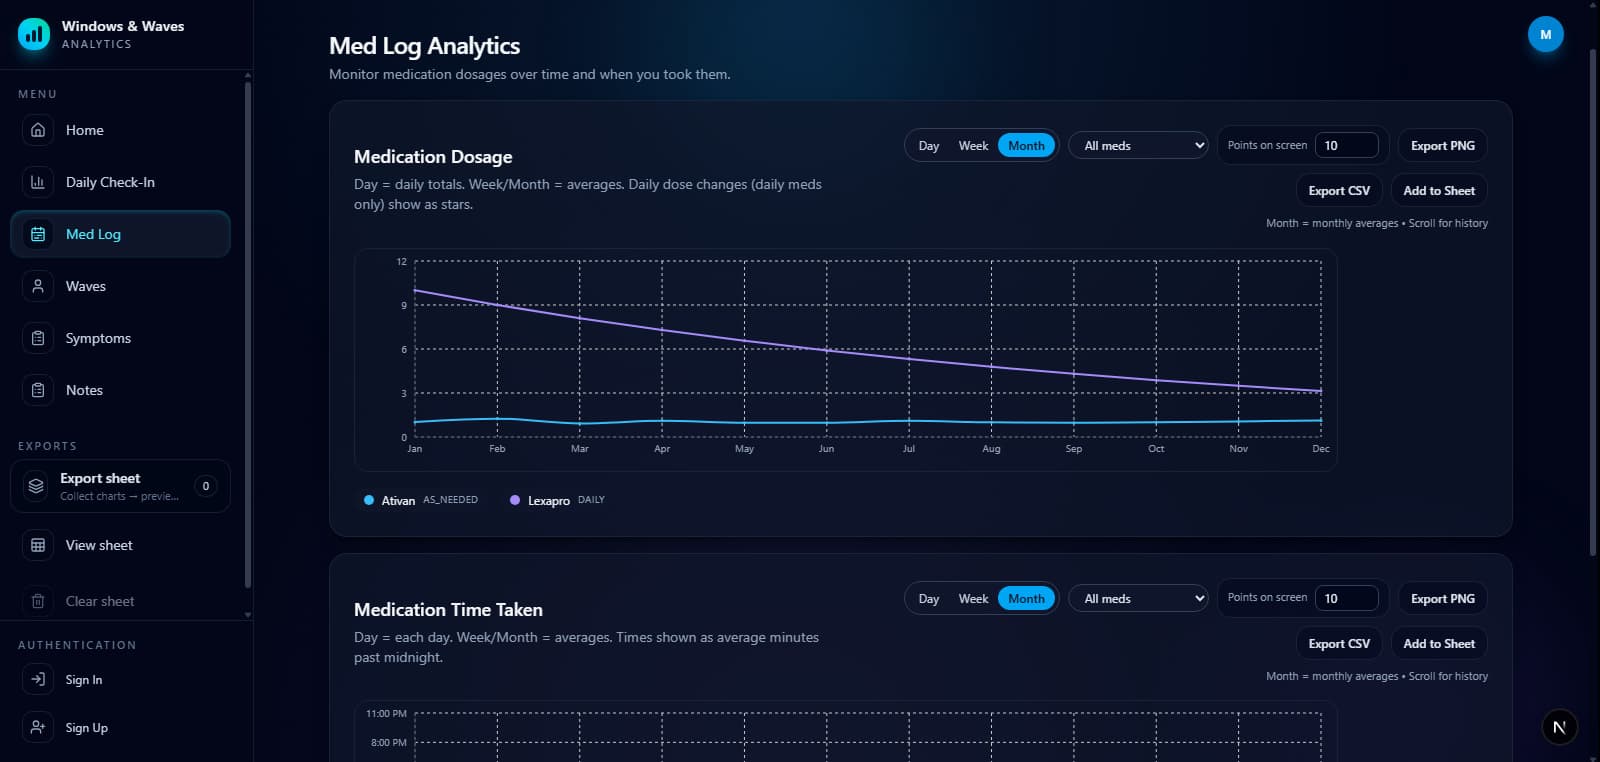
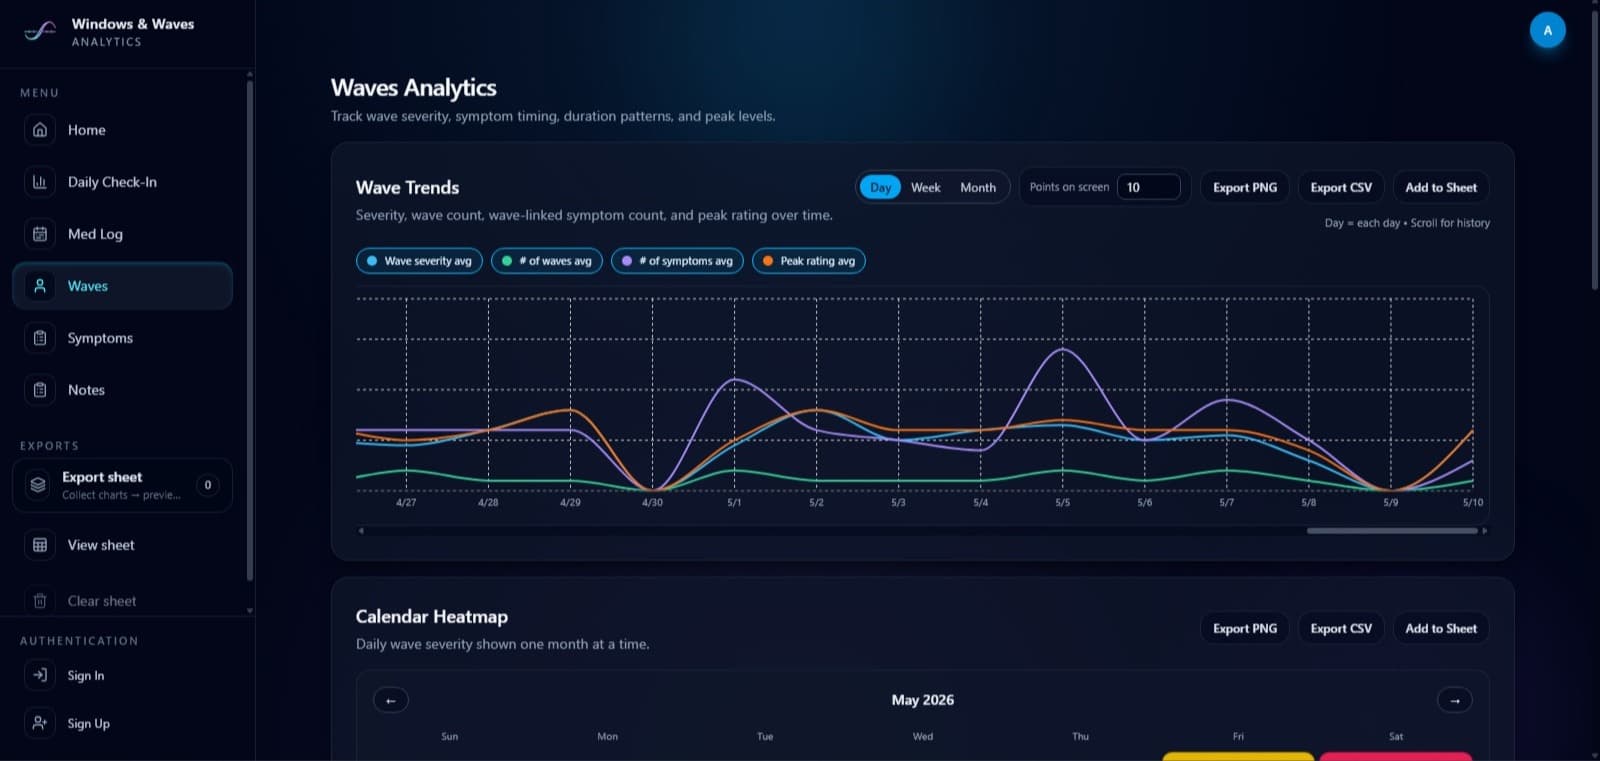
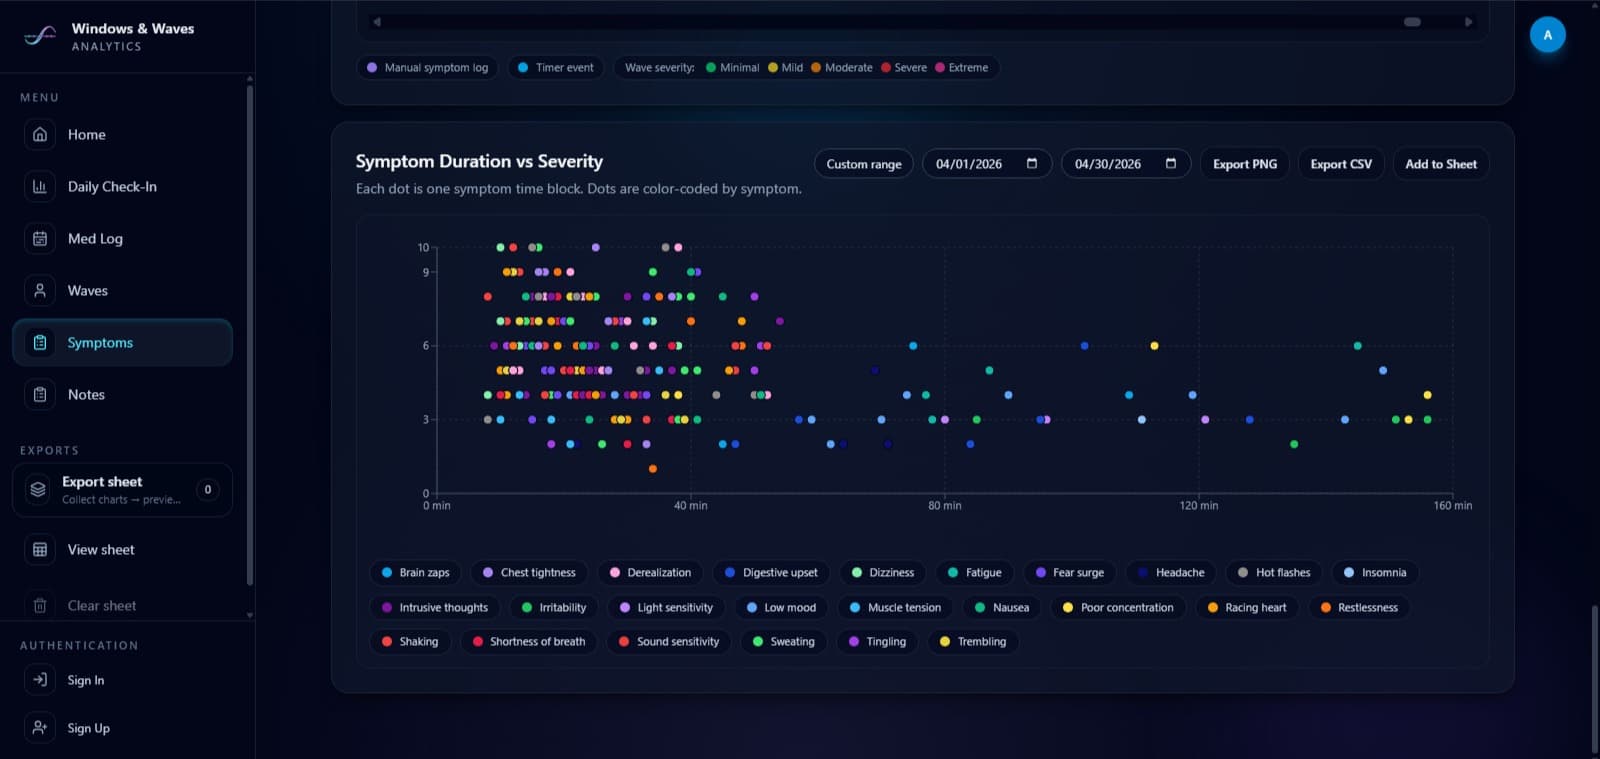
ANALYTICS DASHBOARD
Explore Your Data From Every Angle
Switch between Daily Check-Ins, medication logs, waves, symptoms, and exports.
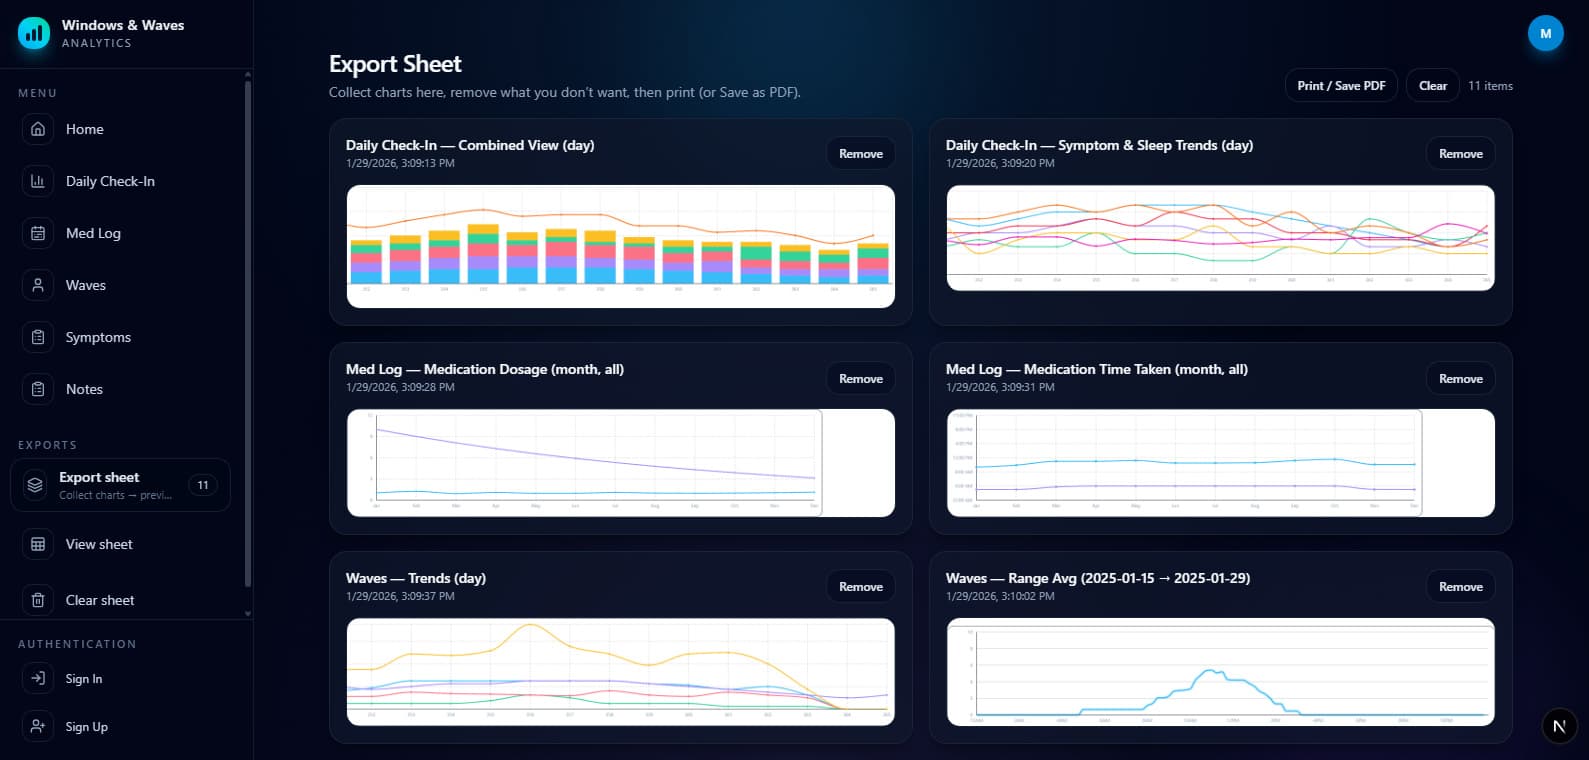
Daily Check-In
Med Log
Waves
Symptoms
Export
Become a Feedback User
Help shape Windows & Waves during its early development. Selected users will receive access to Pro features, explore the platform before the official launch, and provide feedback that directly improves the experience.
All About Feedback Users
Everything you need to know about becoming a feedback user, what to expect, and how your input helps shape the future of Windows & Waves.
Windows & Waves Tracker is currently in an early stage of development. Your feedback helps us better understand the needs of the community and improve the overall experience.
Feedback users will receive a custom link to download the app and will be among the first to explore both the app and Pro features on the app and website. After 6 weeks, users will be asked to answer a short set of questions about their experience.
We prefer that feedback users are currently (now or in the past) tapering a psychiatric medication and are doing so under a doctor’s supervision.
After completing the questionnaire, feedback users will receive lifetime access to Pro features on the website and on the app.
Fill out a short application here. The application does not require sensitive personal information. It includes a username and an email so we can send your access link and questionnaire. You will also be asked whether you are currently tapering a psychiatric medication and whether you are doing so under a doctor’s supervision.
The Windows & Waves team will use your feedback to improve the app and website before the official public launch. Your responses will only be used internally and will not be shared with any third parties. Your input is highly valuable in helping us create the best possible tools for individuals currently withdrawing from psychiatric medications.